Introduction
Like the 713 million monthly active users worldwide, I use Spotify to listen to music. This streaming service is one of the most popular global music streaming platforms, making its data highly suitable for analyzing contemporary pop culture, key musical trends, and patterns.
Using Perplexity and Kaggle, I found a relevant dataset that contains information up to 2025 and includes data on the following parameters: — track popularity, calculated based on user interactions; — artist genres; — track duration in minutes; — presence or absence of explicit content; — additional characteristics of artists and tracks.
The volume of data allows for both descriptive analysis and comparison across different groups.
In this project, I am analyzing Spotify data to understand: — which genres are most popular; — how the average track length is changing; — whether explicit language affects music popularity.
Stylistic Concept
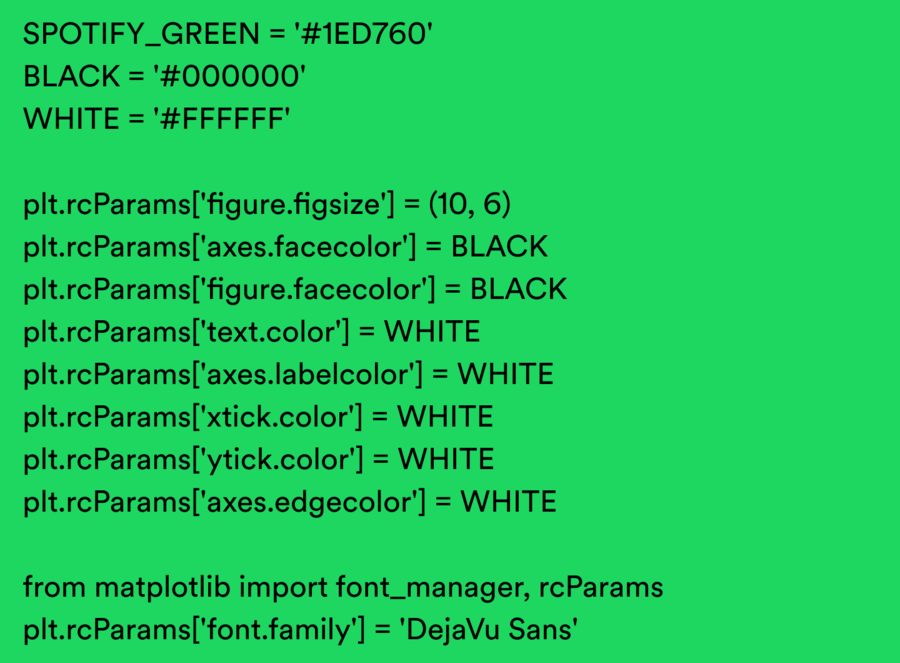
For the color palette, I chose Spotify’s primary colors—green, black, and white—and used «DejaVu Sans» as the primary typeface because it aligns with the service’s style and contains all the necessary characters.
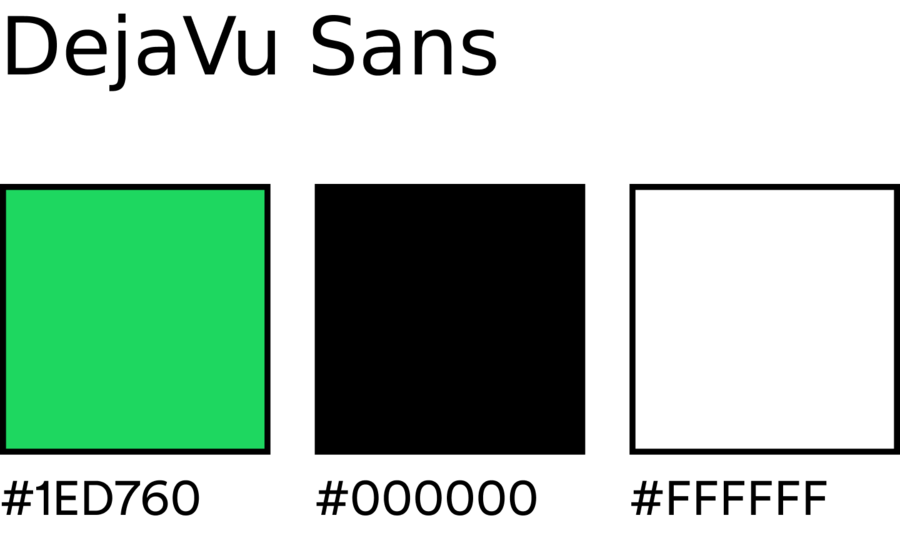
To visualize the data in the appropriate style, I initially set the necessary colors and font in the code.
Statistical Methods Used
The project utilizes descriptive statistics and categorical analysis methods: — Mean — to assess average track popularity and duration; — Median — for a robust estimation of central tendency; — Number of observations — to evaluate genre representativeness; — Data grouping — for analyzing categorical features; — Distribution analysis — for comparing the popularity of explicit versus non-explicit tracks; — Category comparison — to identify differences between genres.
The use of these methods allows for interpretable and reproducible results without overcomplicating the model.
Furthermore, two data visualization formats are utilized: exploratory and explanatory.
The exploratory format is applied to impartially present data structure and uncover fundamental patterns, such as genre distribution and average track length.
The explanatory format is used to interpret the findings and formulate an analytical stance regarding the influence of explicit content and genre context on musical popularity.
Combining these formats allows for the construction of an analytical narrative, moving from observation to conclusion.
Preliminary Preparation
First, I imported the necessary libraries and loaded the dataset itself:
Before analysis began, the data was cleaned and prepared. Missing values in the genre column were replaced with null values, and then the genre strings were standardized to a unified format.
Since one artist can belong to multiple music genres, the data was normalized: the list of genres was split and expanded so that each genre could be analyzed as a separate observed category. This allowed for a more accurate assessment of genre popularity and characteristics.
What genres are most popular?
First, I prepared the data for this chart.
A bar chart is the most suitable tool for comparing categorical data. In this case, it visually allows us to compare the popularity of different genres against each other.
Only the top 10 genres were selected for visualization to avoid visual clutter and focus attention on the most significant categories.
What the chart shows: — which genres dominate the Spotify platform; — the differences between genres based on average popularity; — the asymmetry of the music market.
So, genre popularity is unevenly distributed. Some genres feature a large number of tracks but have moderate average popularity, while others—such as alternative pop—achieve high popularity with a smaller volume of content.
Average track duration by genre
Data preparation for the chart:
A violin plot is used to analyze track duration because it allows us to study not only the average value but also the distribution of composition lengths within each genre.
Unlike a bar chart, this type of visualization shows the spread of values, the density of the distribution, and the median values—which is particularly important when analyzing music formats.
Track duration is a key characteristic that reflects the format of music consumption. It helps reveal differences between genres and understand how musical compositions adapt to modern listening conditions.
The chart demonstrates: — differences in track duration distribution across genres; — the degree of variability within each genre; — the relationship between genre and music composition format.
Analysis shows that commercially oriented genres feature shorter, less varied tracks, whereas niche and experimental genres more frequently include longer compositions with a wider range of durations.
This may be related to the algorithms of streaming services, which are geared toward listener retention, as well as shifts in user music listening patterns.
The Influence of Profanity on Popularity